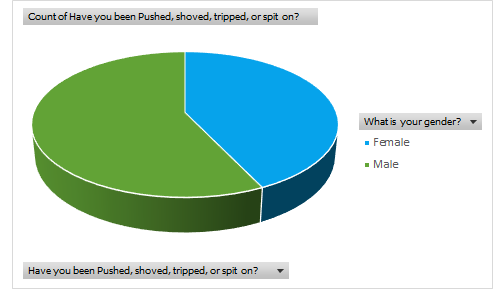
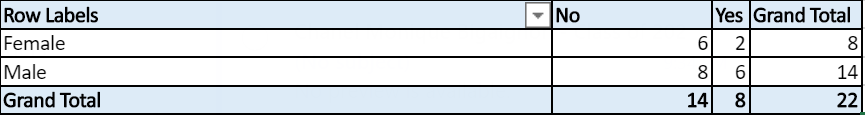
This pie chart shows which females and males in our class have been pushed, shoved, tripped or spitted on. As it says on the table below, 6 females have not and 2 have which makes the total 8. Then is says 8 males have not and 6 have, which makes the total 14. All together 14 students have not and only 8 have which makes the grand total 22. It is good that the majority of students have not been pushed, tripped, shoved or spitted on because that makes their life easier without having to deal with the bad memories of that moment.
